The CredSpark Interaction Submission report provides a summary of Interaction submissions broken out by week. This report is useful to track submissions for a specific form, or across multiple forms. For example, track the number of lead form submissions throughout the year, each month, or every week over the course of a LeadGen campaign.
The report filters are composed of Title, Start Date, End Date and Break Out New/Existing Customers. NOTE: The available data for this report only extends to 18 months. To profile all forms withing a given date range, select the Title filter (All Titles) option:
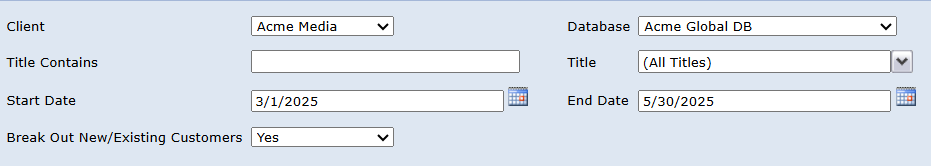
Filter results down by selecting a date range, selecting individual forms (or all), or by entering a word in the Title Contains field to filter down by similar form names. You can also break the report out by New and Existing customers.
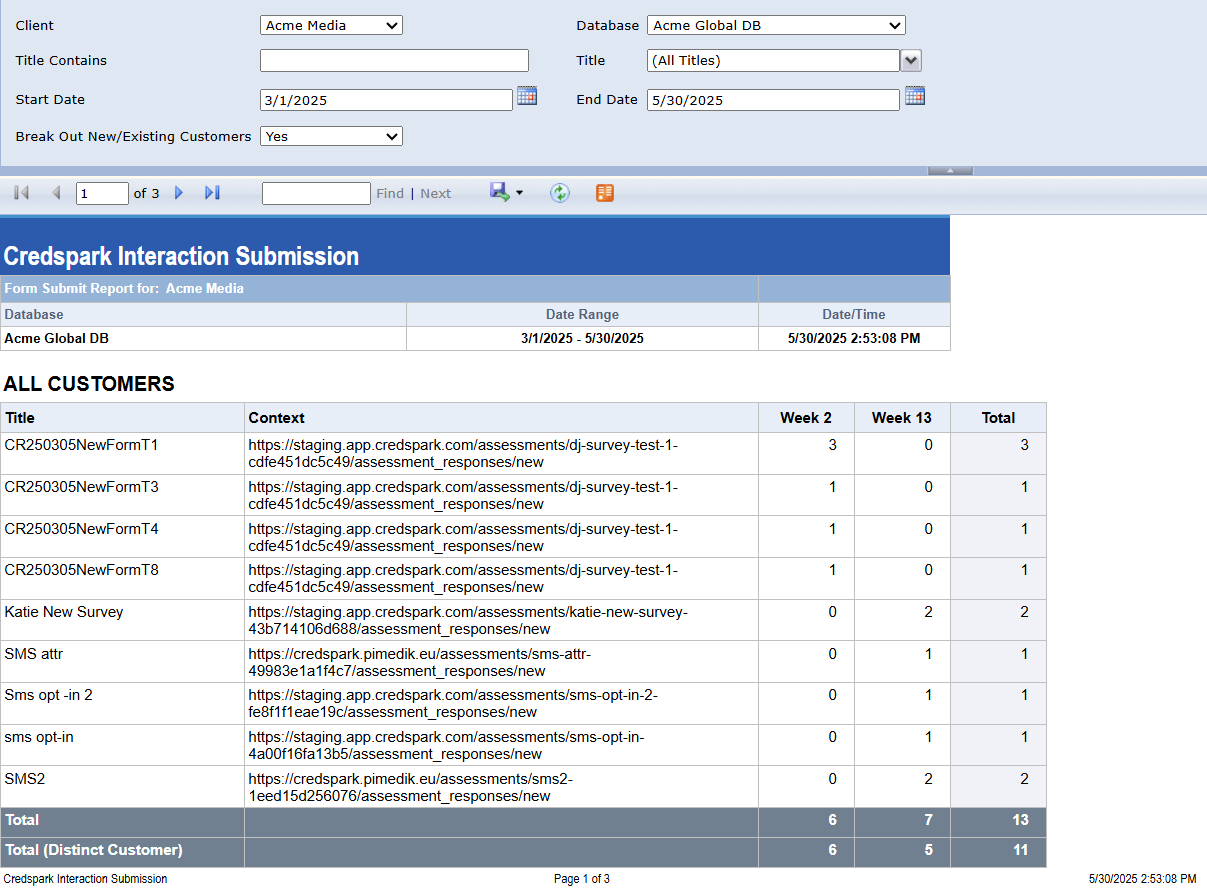
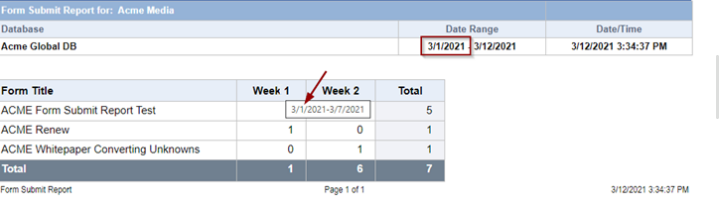
Each weekly count will show the number of customers who submitted a given form within each week. Weeks are determined by the report date range; so week 1 is the first 7 days from the report start date, week 2 is day 8 to 14, etc. Hovering over a Week header will display the date range for the specific week. Here, the report start date is 3/1 so week 1 runs between 3/1 and 3/7:
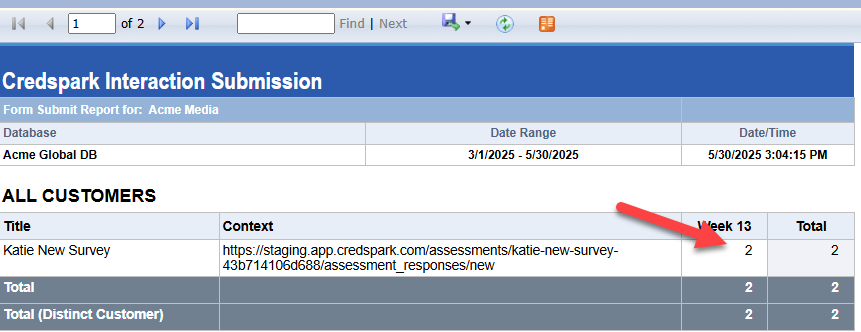
Counts are clickable and return a more detailed accounting for the submission, including the products or opt-ins for which a customer registered.

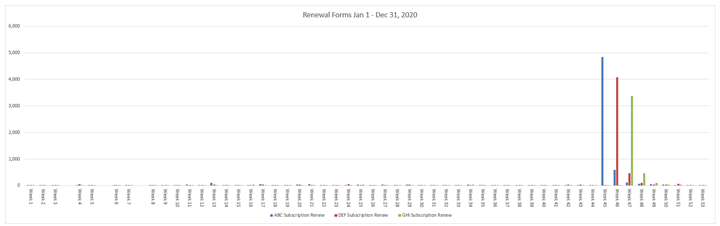
Or, the report can be exported to Excel to run filters, pivots and charts. For example, plotting renewal form submissions might suggest opportunities for spreading renewal campaigns throughout the year:
If you have it as Yes chosen for the ‘Break out by New/Existing Customers', then it will be broken down like so:
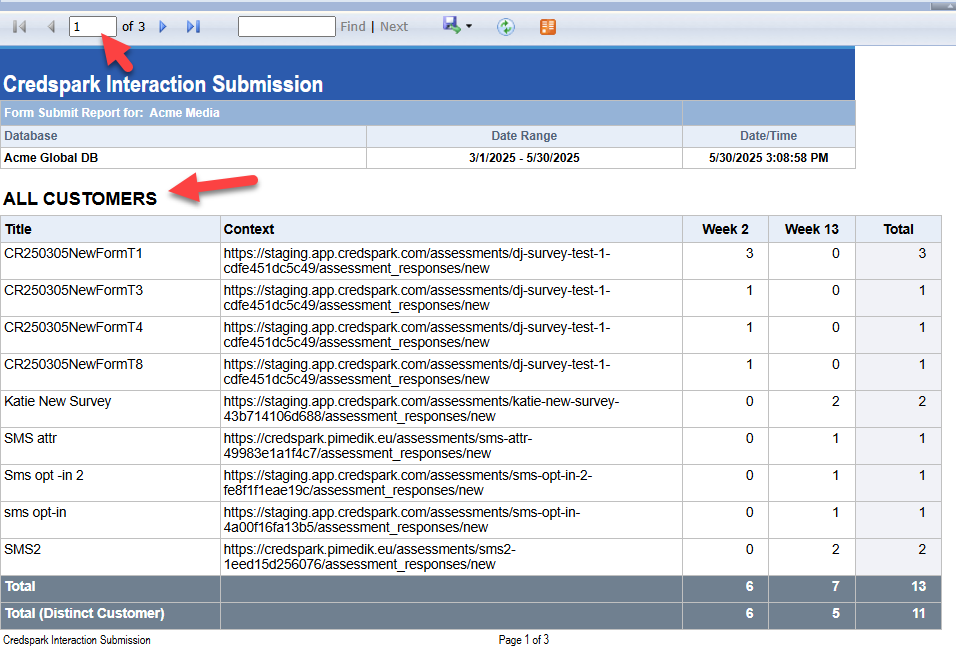
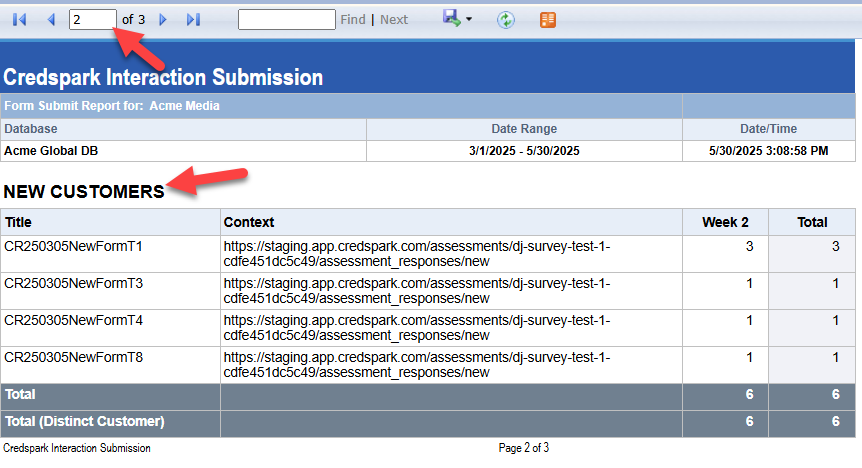
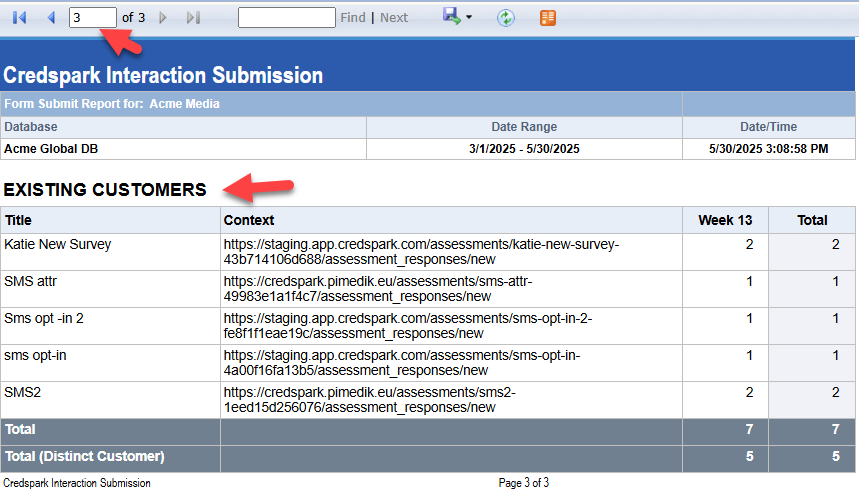
Table of Contents