Overview
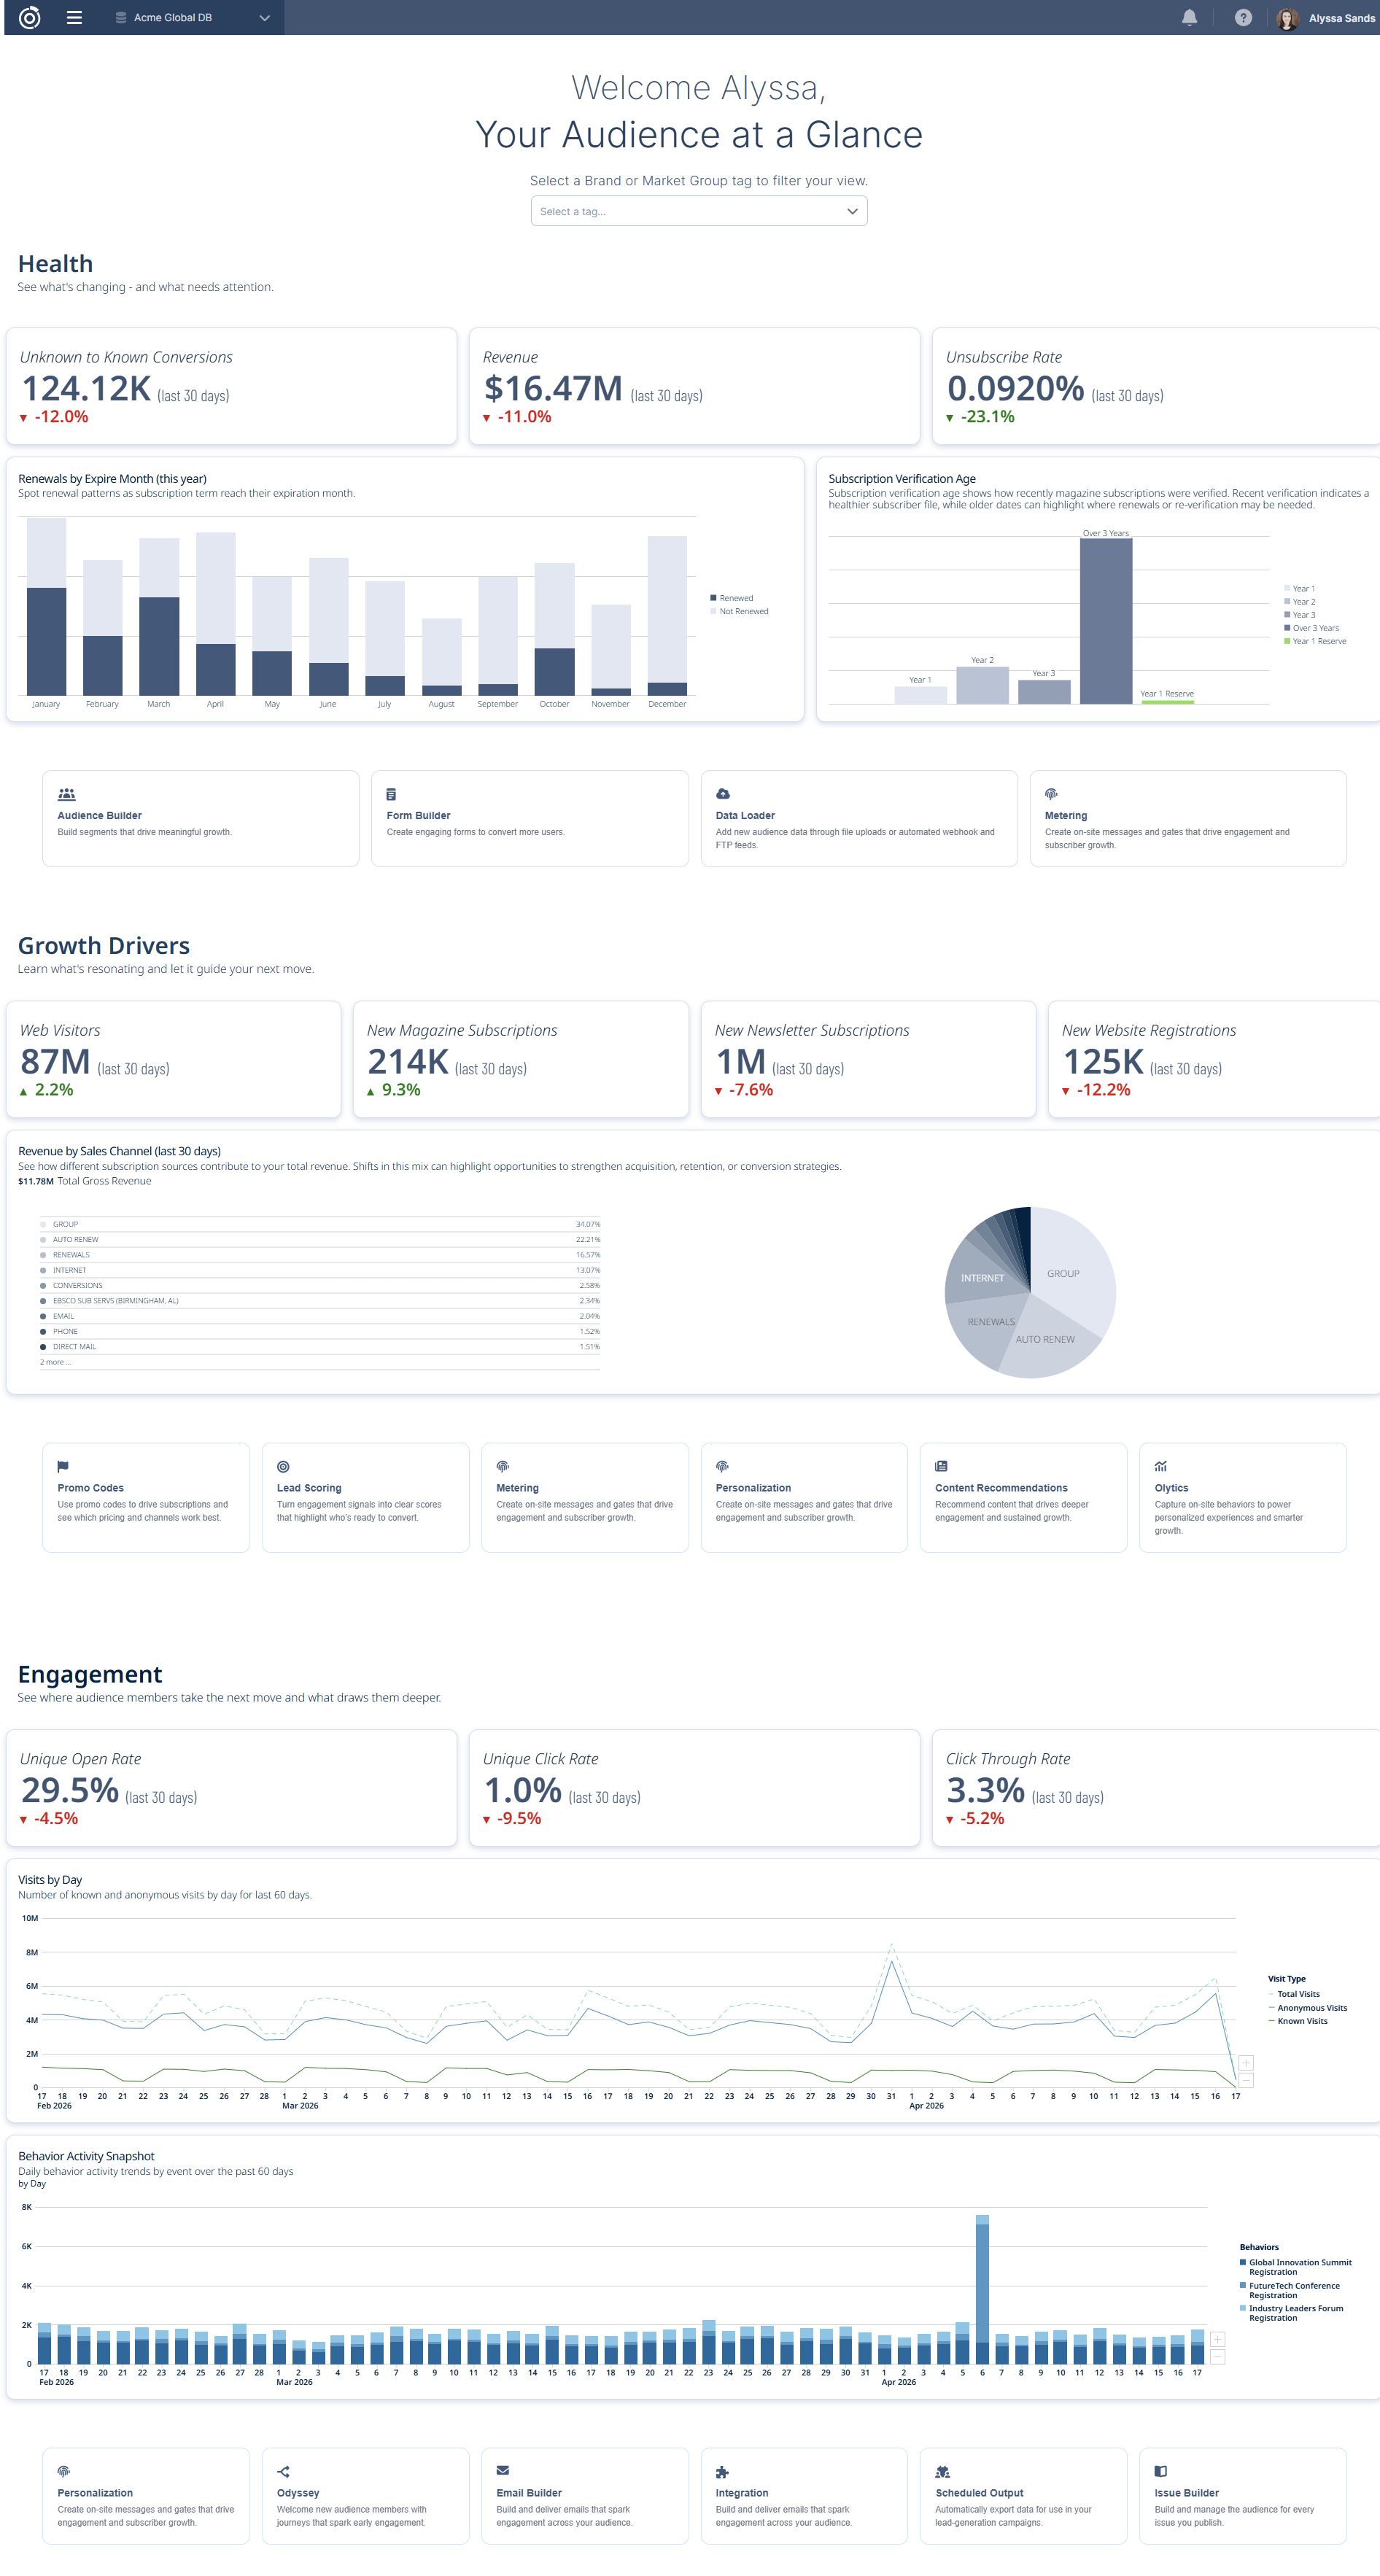
The homepage provides an audience-first view of performance, insights, and recommended actions at login. It surfaces key signals across audience health, growth, and engagement—so users can quickly understand what’s happening and where to focus.
All data is read-only and can be filtered by Brand or Market tags, allowing users to focus on the most relevant audience segments.
Structure
The homepage is organized into four sections that together tell the story of your audience from top to bottom. It opens with a filtering tool that scopes the entire page to a specific brand or market group, followed by a Health section that surfaces key indicators requiring attention, a Growth Drivers section that highlights what's fueling audience expansion, and an Engagement section that shows how your audience is interacting with your content and communications.
1. Welcome & Brand/Market Selector
Purpose
Filters the homepage to a specific audience grouping based on your tagging strategy.
What are Brand and Market Tags?
Brand and Market are tag types configured in Client Empowerment that group related assets such as:
-
Products
-
Behaviors
-
Demographics
-
Deployment types
Tags allow you to organize your data in a way that reflects your business structure and strategy.
How Tags Power the Homepage
-
The selector uses Brand and Market tags created in Database Settings
-
All KPIs and charts dynamically update based on the selected tag
-
Provides a consistent lens across tools and reporting
How to Create or Manage Tags
To configure Brand or Market groupings:
-
Go to Database Settings → Tags
-
Click Create Tag
-
Define:
-
Name
-
Type (Brand, Market, or Other)
-
-
Assign assets (products, behaviors, deployments, etc.)
-
Save
Once saved, the tag applies across all selected assets and becomes available throughout the platform.
For full instructions, see:
Client Empowerment: Tags
2. Audience Health
Purpose
Provides a snapshot of overall audience stability and risk.
KPIs
-
Unknown to Known Conversions (Last 30 Days)
-
Definition: The number of unique audience members across the organization who were identified for the first time within the last 30 days — measured as the first instance an anonymous visitor record was merged into a known record. When the brand or market group filter is used, conversions that occur in tandem with the associated olytics behaviors will display.
-
Why it matters: This metric tracks how effectively your organization (or brand or market group) is converting anonymous visitors into identified audience members — a key indicator of audience development health.
-
-
Revenue (Last 30 Days)
-
Definition: The total gross revenue generated across the organization within the last 30 days — measured as the combined dollar value of all subscription and sales transactions processed during that period. When the brand or market group filter is used, only revenue associated with transactions tied to the products associated with the brands or market groups will display.
-
Why it matters: This metric tracks the overall financial performance of your audience monetization efforts — a key indicator of subscription and sales health across the organization.
-
-
Unsubscribe Rate (Last 30 Days)
-
Definition: The percentage of delivered messages that resulted in an unsubscribe, calculated as unsubscribes divided by delivered messages within the last 30 days. When the brand or market group filter is used, only unsubscribe events associated with deployment types tied to those brands or market groups will display.
-
Why it matters: This metric tracks how frequently your audience is opting out of communications — a key indicator of list health, content relevance, and overall audience engagement quality.
-
Charts
-
Renewals by Expire Month (this year)
-
Definition: A bar chart displaying subscription renewal patterns grouped by the month in which subscriptions are set to expire throughout the current year — measured as the volume of renewed versus not-renewed subscriptions for each expiration month. When the brand or market group filter is used, only renewals associated with the related magazine products will display.
-
Why it matters: This metric tracks how effectively your organization is converting expiring subscriptions into renewals month by month — a key indicator of retention performance and where intervention may be needed to reduce subscription churn.
-
-
Subscription Verification Age
-
Definition: A bar chart displaying how recently magazine subscriptions were verified, grouped by verification age — measured as the distribution of subscriptions across verification timeframes (Year 1, Year 2, Year 3, etc.) as defined at the individual magazine product level. Date ranges for each verification tier reflect the recency definitions configured for each product. When the brand or market group filter is used, only subscriptions associated with the related magazine products will display.
-
Why it matters: This metric tracks the age and freshness of your subscriber verification data — a key indicator of subscriber file health, where recent verification suggests a cleaner file and older verification dates may signal a need for re-verification outreach.
-
Taking Action
Each section includes links into relevant areas of the platform based on your configuration.
These entry points:
-
Reflect your licensed features
-
Adapt to your enabled capabilities
-
Allow you to move from insight to action
3. Growth Drivers
Purpose
Highlights acquisition and expansion trends.
KPIs
-
Web Visitors (Last 30 Days)
-
Definition: The total number of visits to your organization's web properties within the last 30 days — measured as the combined count of both known and anonymous visitor sessions across all tracked sites. When the brand or market group filter is used, only visits associated with the related olytics tracking will display.
-
Why it matters: This metric tracks the overall reach and traffic volume of your web presence — a key indicator of audience engagement and the top of the funnel for converting anonymous visitors into known audience members.
-
-
New Magazine Subscriptions (Last 30 Days)
-
Definition: The total number of new active magazine subscriptions started within the last 30 days — measured as the count of first-time subscription orders in an active status across all magazine products in the organization. When the brand or market group filter is used, only new active subscriptions associated with the related magazine products will display.
-
Why it matters: This metric tracks how effectively your organization is acquiring new magazine subscribers — a key indicator of print and digital magazine audience growth and the performance of your subscription acquisition efforts.
-
-
New Newsletter Subscriptions (Last 30 Days)
-
Definition: The total number of new active newsletter subscriptions started within the last 30 days — measured as the count of first-time newsletter subscriptions in an active status across all newsletter products in the organization. When the brand or market group filter is used, only new active newsletter subscriptions associated with the related newsletter products will display.
-
Why it matters: This metric tracks how effectively your organization is growing its newsletter audience — a key indicator of email audience development and the performance of your newsletter acquisition efforts.
-
-
New Website Registrations (Last 30 Days)
-
Definition: The total number of new website registrations completed within the last 30 days — measured as the count of first-time active website product entitlements across all web properties in the organization. When the brand or market group filter is used, only new registrations associated with the related web products will display.
-
Why it matters: This metric tracks how effectively your organization is converting web visitors into registered audience members — a key indicator of audience development and the performance of your website registration and gating strategies.
-
Charts
-
Revenue by Sales Channel
-
Definition: A breakdown of total gross revenue by subscription source sales channel within the last 30 days — measured as the dollar value and percentage contribution of each sales channel (such as group, auto-renew, renewals, internet, conversions, and direct mail) to the overall revenue mix. When the brand or market group filter is used, only revenue associated with the related magazine products will display.
-
Why it matters: This metric tracks how different subscription acquisition and retention channels contribute to your total revenue — a key indicator of channel performance and mix, helping to highlight opportunities to strengthen acquisition, retention, or conversion strategies.
-
Taking Action
Action links are dynamically generated based on your environment and may vary by customer.
4. Engagement
Purpose
Measures how actively your audience interacts with content and campaigns.
KPIs
-
Unique Open Rate (Last 30 Days)
-
Definition: The percentage of delivered messages that were opened by a unique recipient within the last 30 days — measured as unique opens divided by delivered messages across all email deployments in the organization. When the brand or market group filter is used, only deployments associated with the related deployment types will display.
-
Why it matters: This metric tracks how effectively your email content is capturing audience attention — a key indicator of subject line performance, sender reputation, and overall email engagement health.
-
-
Unique Click Rate (Last 30 Days)
-
Definition: The percentage of delivered messages that received at least one unique click within the last 30 days — measured as unique clicks divided by delivered messages across all email deployments in the organization. When the brand or market group filter is used, only deployments associated with the related deployment types will display.
-
Why it matters: This metric tracks how effectively your email content is driving audience action — a key indicator of content relevance, call-to-action performance, and overall email engagement health.
-
-
Click Through Rate (Last 30 Days)
-
Definition: The percentage of opened messages that resulted in at least one unique click within the last 30 days — measured as unique clicks divided by unique opens across all email deployments in the organization. When the brand or market group filter is used, only deployments associated with the related deployment types will display.
-
Why it matters: This metric tracks how effectively your email content is converting readers into active engagers — a key indicator of content quality, relevance, and the performance of calls to action within your emails.
-
Charts
-
Visits by Day (Last 60 Days)
-
Definition: A time series chart displaying the daily volume of visits to your organization's web properties over the last 60 days — measured as the count of total visits, known visits, and anonymous visits by day across all tracked sites. When the brand or market group filter is used, only visits associated with the related olytics tracking will display.
-
Why it matters: This metric tracks daily web traffic patterns across your audience — a key indicator of content performance, campaign impact, and seasonal trends in audience engagement behavior.
-
-
Behavior Activity Snapshot (Last 60 Days)
-
Definition: A bar chart displaying daily behavior activity trends grouped by behavior over the last 60 days — measured as the count of audience behavior events recorded per day across the organization. When the brand or market group filter is used, only events associated with the related behaviors will display.
-
Why it matters: This metric tracks how your audience is engaging with your organization beyond web browsing — a key indicator of deeper audience interest, content consumption patterns, and the effectiveness of your events and content marketing strategies.
-
Taking Action
This section provides contextual entry points into tools that support engagement and retention strategies, depending on your configuration.
Table of Contents