
Available November 20. This article covers the new Audience Insights, which goes live on November 20. Until then, current dashboards work as they do today.
With build access, you can build your own cards from Audience Insights data: your own version of an Essential Insights card, a different cut of the data, or a new metric. The steps are the same whether you're adding the card to a dashboard or an app.
Starting a new card
On a dashboard, select + in the toolbar, then select Create new Card. To start a card from an app, see Building Your Own App.
Card types
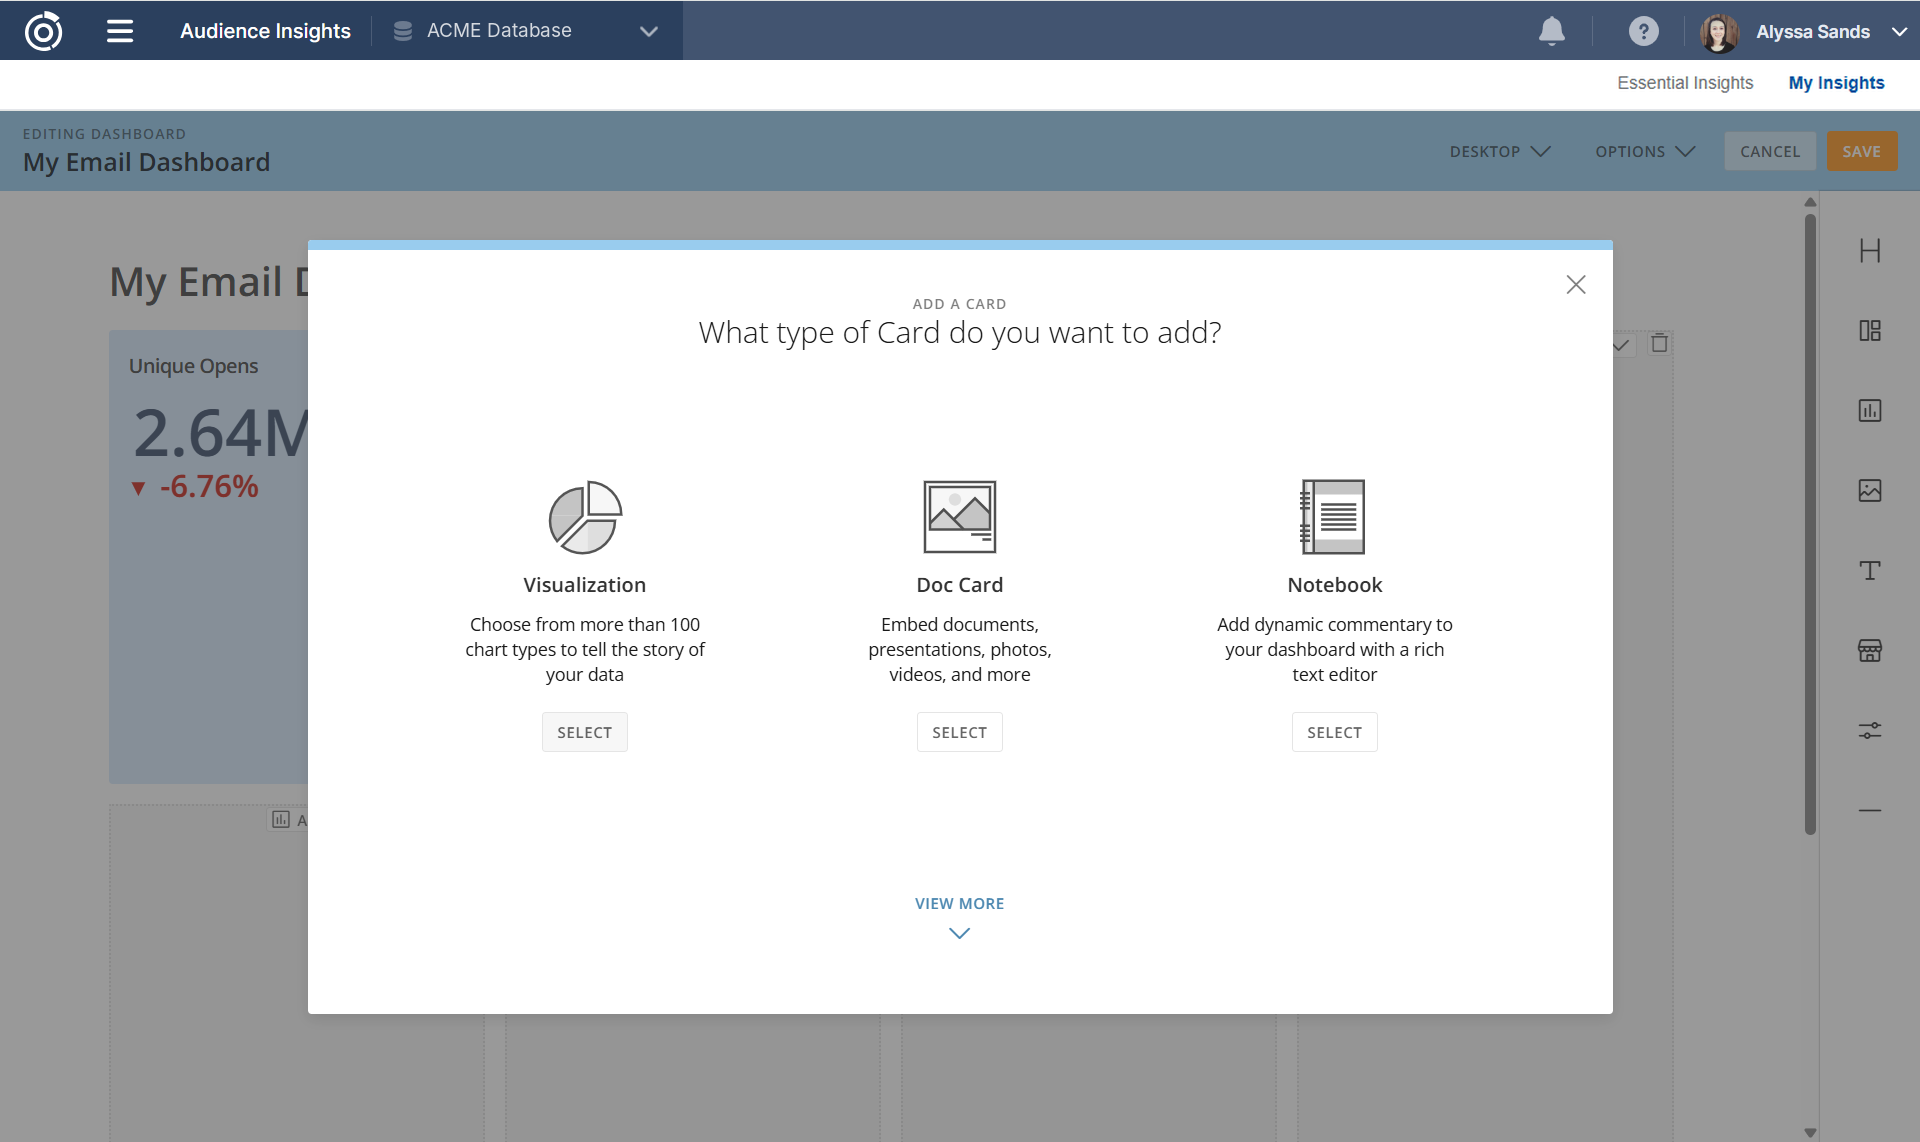
When you create a new card, you're asked what type of card to add:
-
Visualization: a chart or table built from Audience Insights data, with more than 100 chart types. This is the card type you'll use most.
-
Doc Card: embed a document, presentation, photo, or video, such as a media kit or campaign brief.
-
Notebook: add written commentary with a rich text editor, such as what a spike means or who owns a metric.
Select View More to see other card types.
Creating a Visualization card
-
Under Visualization, select Select.
-
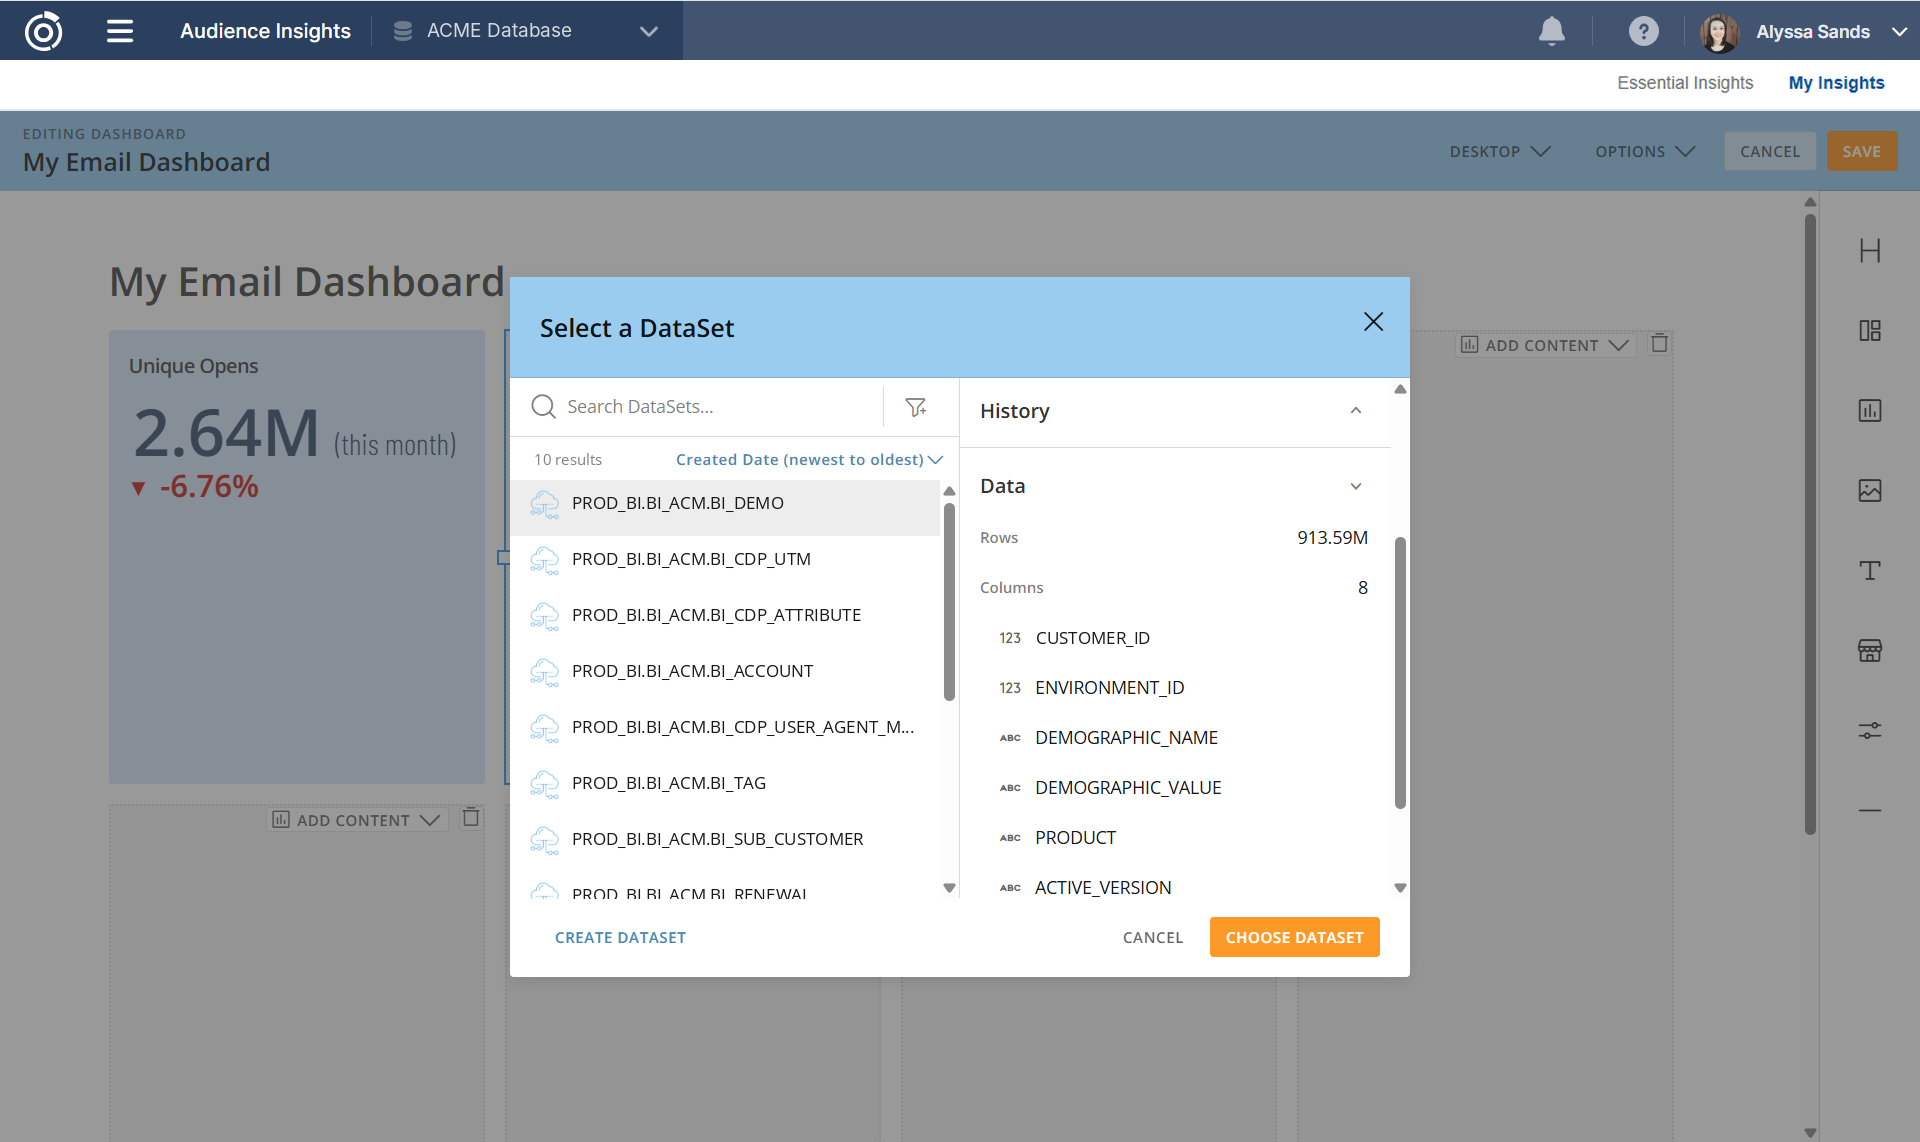
In the Select a DataSet window, choose the dataset you want to use. The right side of the window shows the dataset's row count and columns. For what each dataset contains, see Audience Insights Data Sources.
-
Select Choose DataSet. The card opens in Analyzer.
Building the card in Analyzer
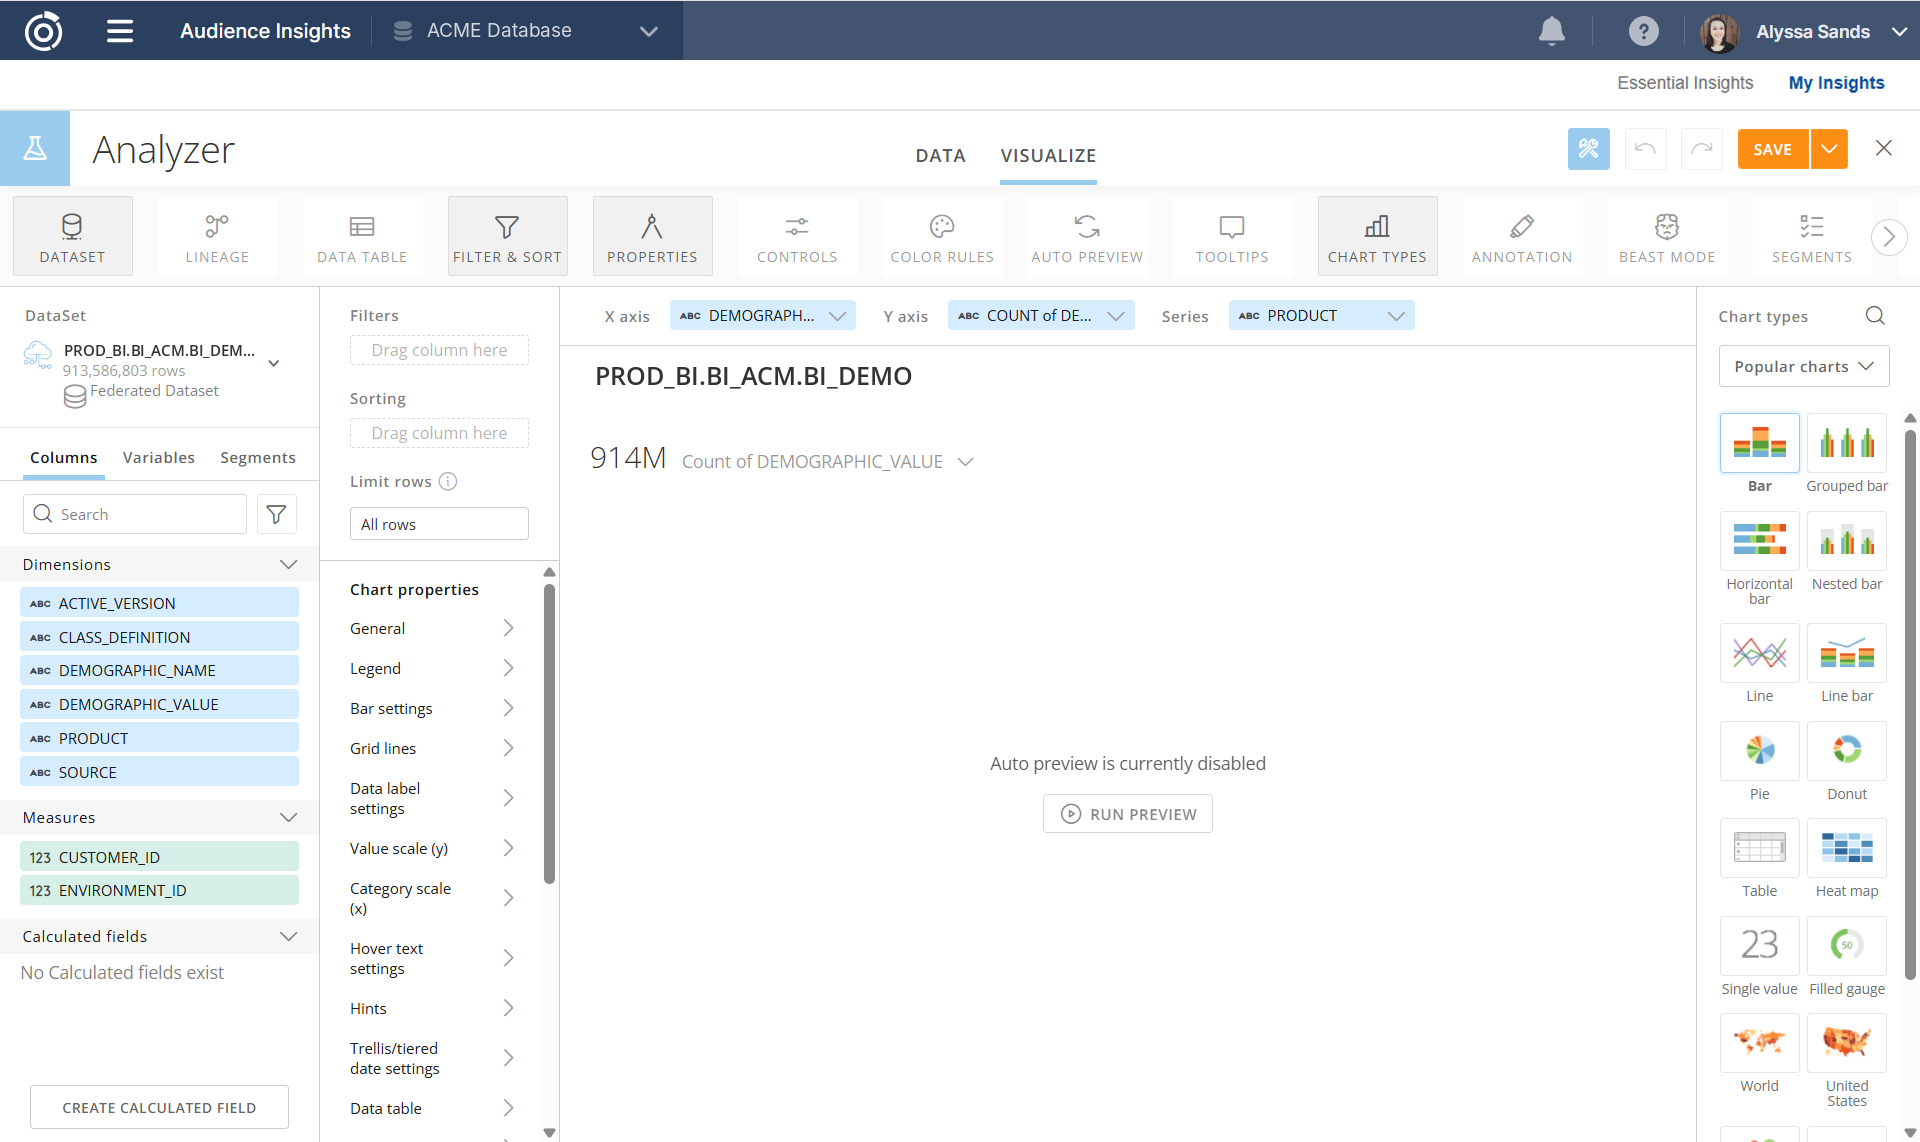
Analyzer is where you choose what the card shows and how it looks.
Columns
The Columns panel on the left lists the dataset's columns in three groups:
-
Dimensions (ABC): text columns to group by, such as PRODUCT or DEMOGRAPHIC_VALUE
-
Measures (123): number columns to count or add up
-
Calculated fields: formulas built on the dataset's columns, such as rates
Column names match the names listed in Audience Insights Data Sources. Use Search at the top of the panel to find a column.
Building the chart
-
Choose a chart type from the Chart types panel on the right (see Choosing a chart type below).
-
Drag columns from the Columns panel to the X axis, Y axis, and Series fields at the top, or choose them from each field's dropdown. Use the Y axis dropdown to choose how values are combined, such as Count or Sum.
-
Select Run Preview to see the chart. To have the preview update on its own as you build, turn on Auto Preview in the toolbar. Audience Insights datasets are large, so Auto Preview can slow things down; you may want to leave it off and preview when you're ready.
-
Select the card title above the chart to rename it.
-
Select Save in the top right.
Choosing a chart type
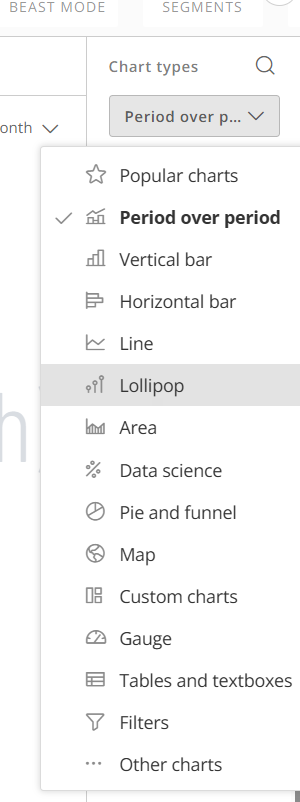
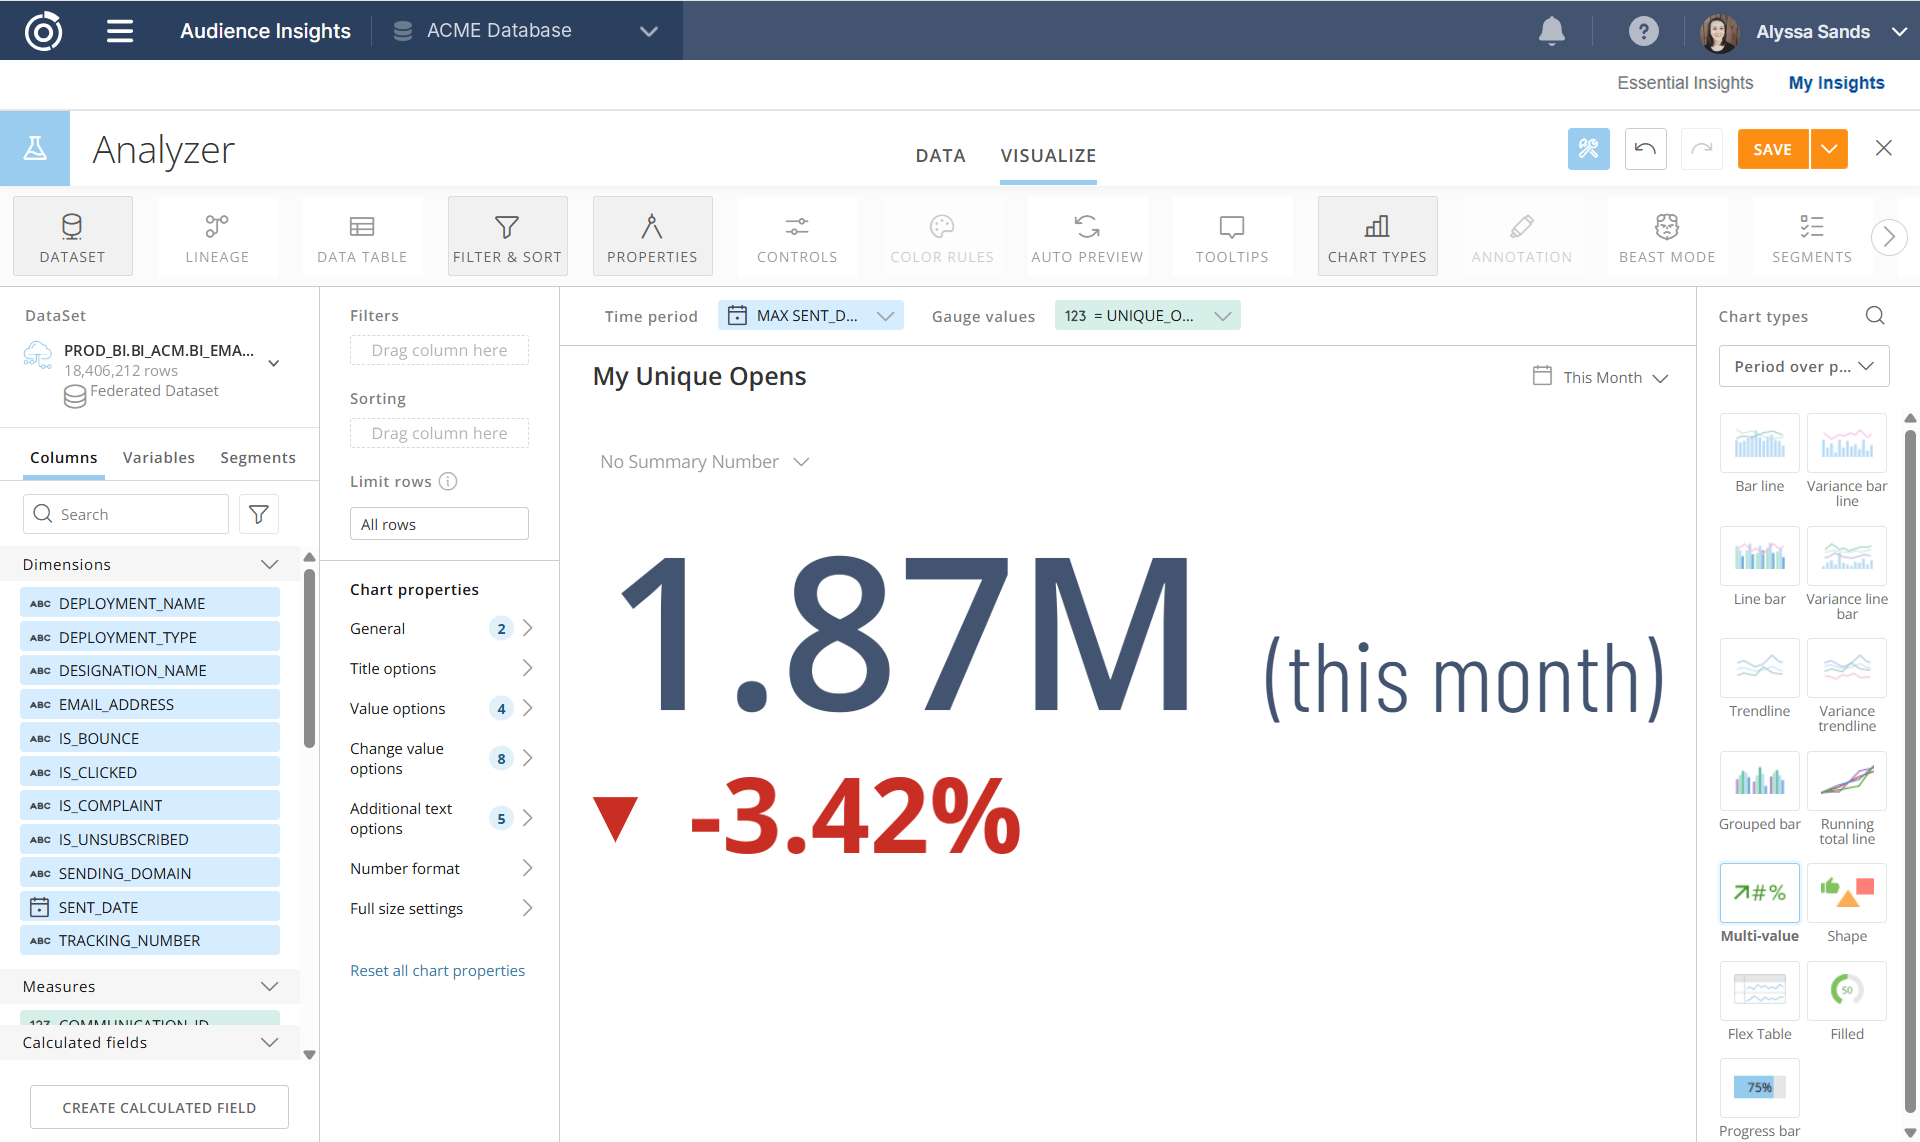
The Chart types panel shows Popular charts first. Use the dropdown to browse by category, or the search icon to find a chart by name. Some common choices:
-
Vertical bar and Horizontal bar: compare values across categories, such as open rate by designation
-
Line and Area: show a trend over time, such as visits by day
-
Period over period: compare a period with the one before it, such as this month vs. last month
-
Pie and funnel: show parts of a whole, or how counts drop off across stages
-
Gauge and Single value (under Popular charts): show one number, such as a KPI
-
Tables and textboxes: show rows of data, or a number with text around it
-
Map: show values by location
The other categories (Lollipop, Data science, Custom charts, Filters, and Other charts) hold more specialized chart types.
Filtering and sorting
Select Filter & Sort in the toolbar, then drag columns to Filters or Sorting. Use Limit rows to show only the top results, such as the top 10 values.
Creating a calculated field (Beast Mode)
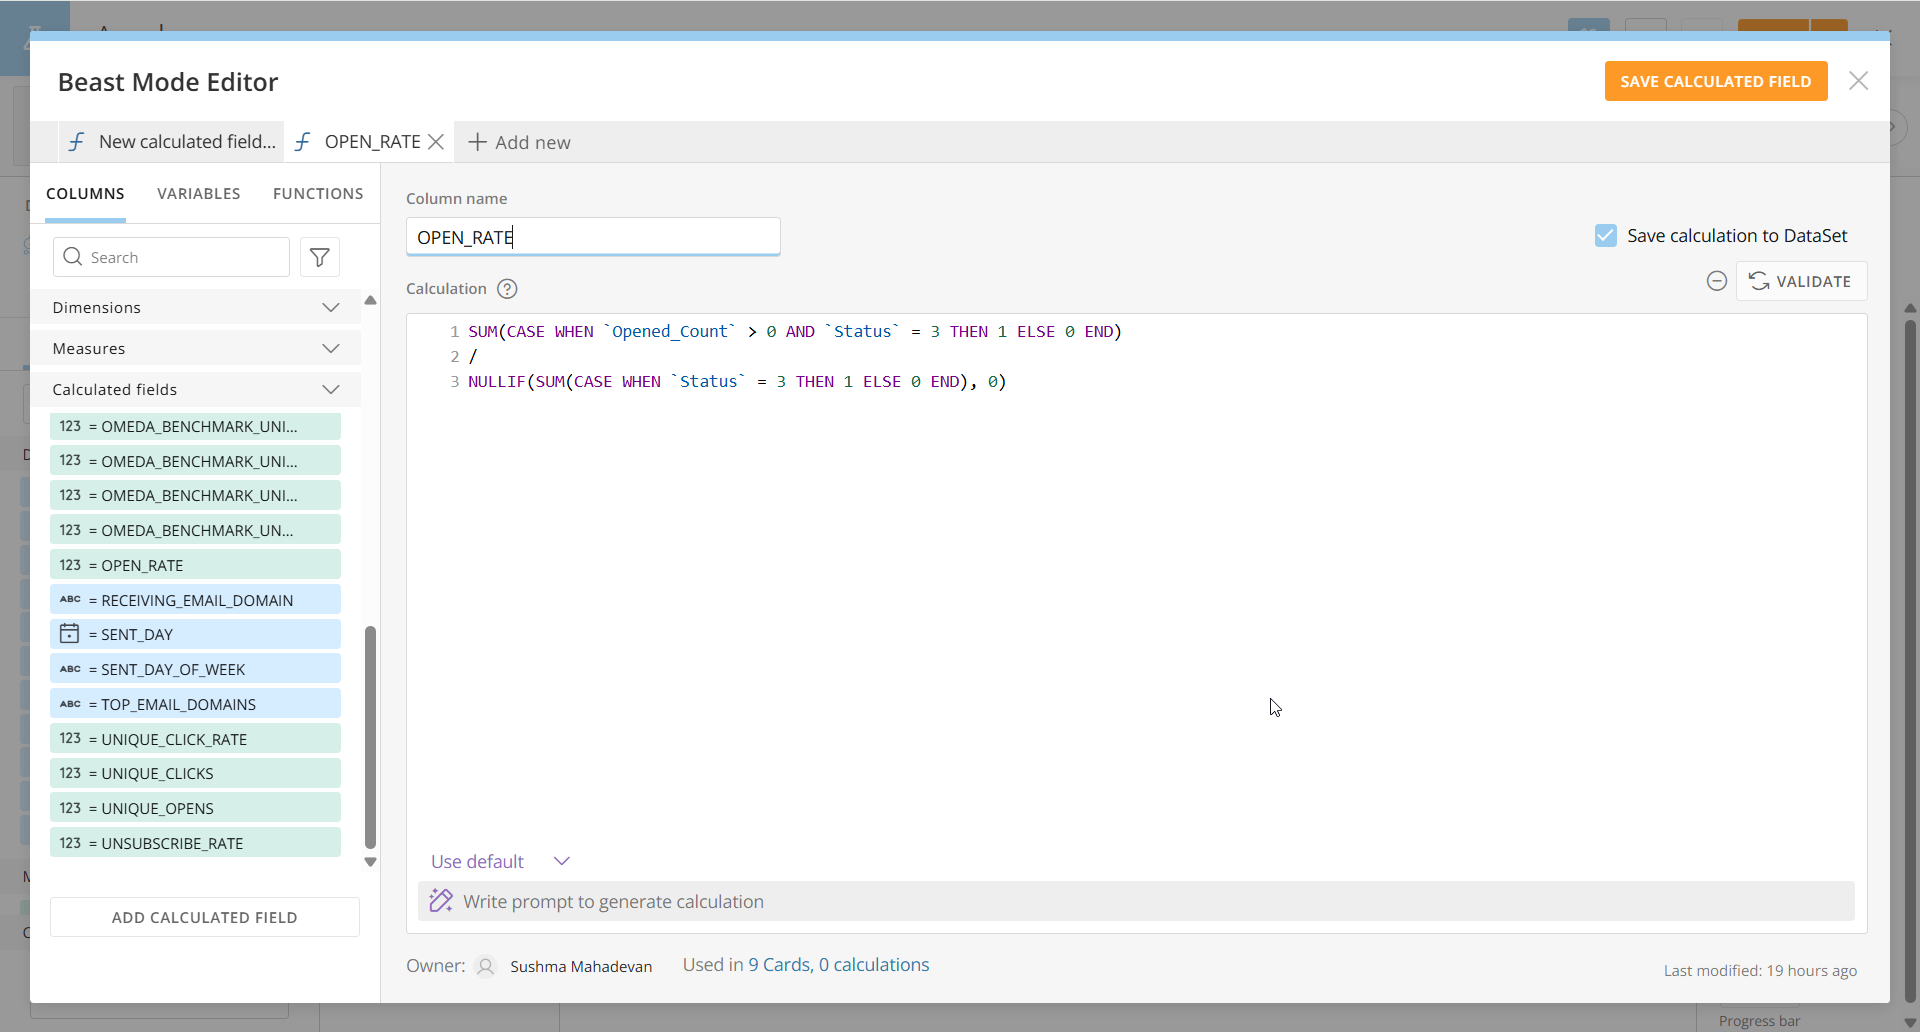
If the metric you need isn't a column, create a calculated field. In Domo, calculated fields are also called Beast Modes.
-
Select Create Calculated Field at the bottom of the Columns panel, or select Beast Mode in the toolbar.
-
Name the field and enter a formula. Use the AI tool for help creating formulas.
-
Save the field. It appears under Calculated fields, and you can use it like any other column.
Beast Mode is also where you create variables: values that viewers can change with a control on a dashboard (see Building a Dashboard).
Adding tooltips
Tooltips let you show extra columns when someone hovers over the chart or in data labels, without adding them to the chart itself. You can add up to three.
-
Select Tooltips in the toolbar to show the Tooltip fields above the chart.
-
Drag a column into Tooltip Field 1. Add more columns to Tooltip Field 2 and 3 if you need them.
-
Open Properties, then Hover text settings or Data label settings.
-
In the Text field, add the Tooltip macros (%_TOOLTIP1, %_TOOLTIP2, %_TOOLTIP3) from the dropdown, along with any other text or macros.
To format a tooltip value, such as decimals or percent, use the format dropdown on its Tooltip field.
Comparing groups with Segments
A segment is a saved group of data, defined by filters, that you can compare against the rest of the data or another group. For example, you could create a segment for one product and compare its open rate to all products.
-
Select Segments in the toolbar.
-
Enter a segment name and, optionally, a description.
-
Add the columns to filter by and choose their values. A preview of the segment shows at the bottom.
-
Select Save & Close.
Seeing which cards use a dataset (Lineage)
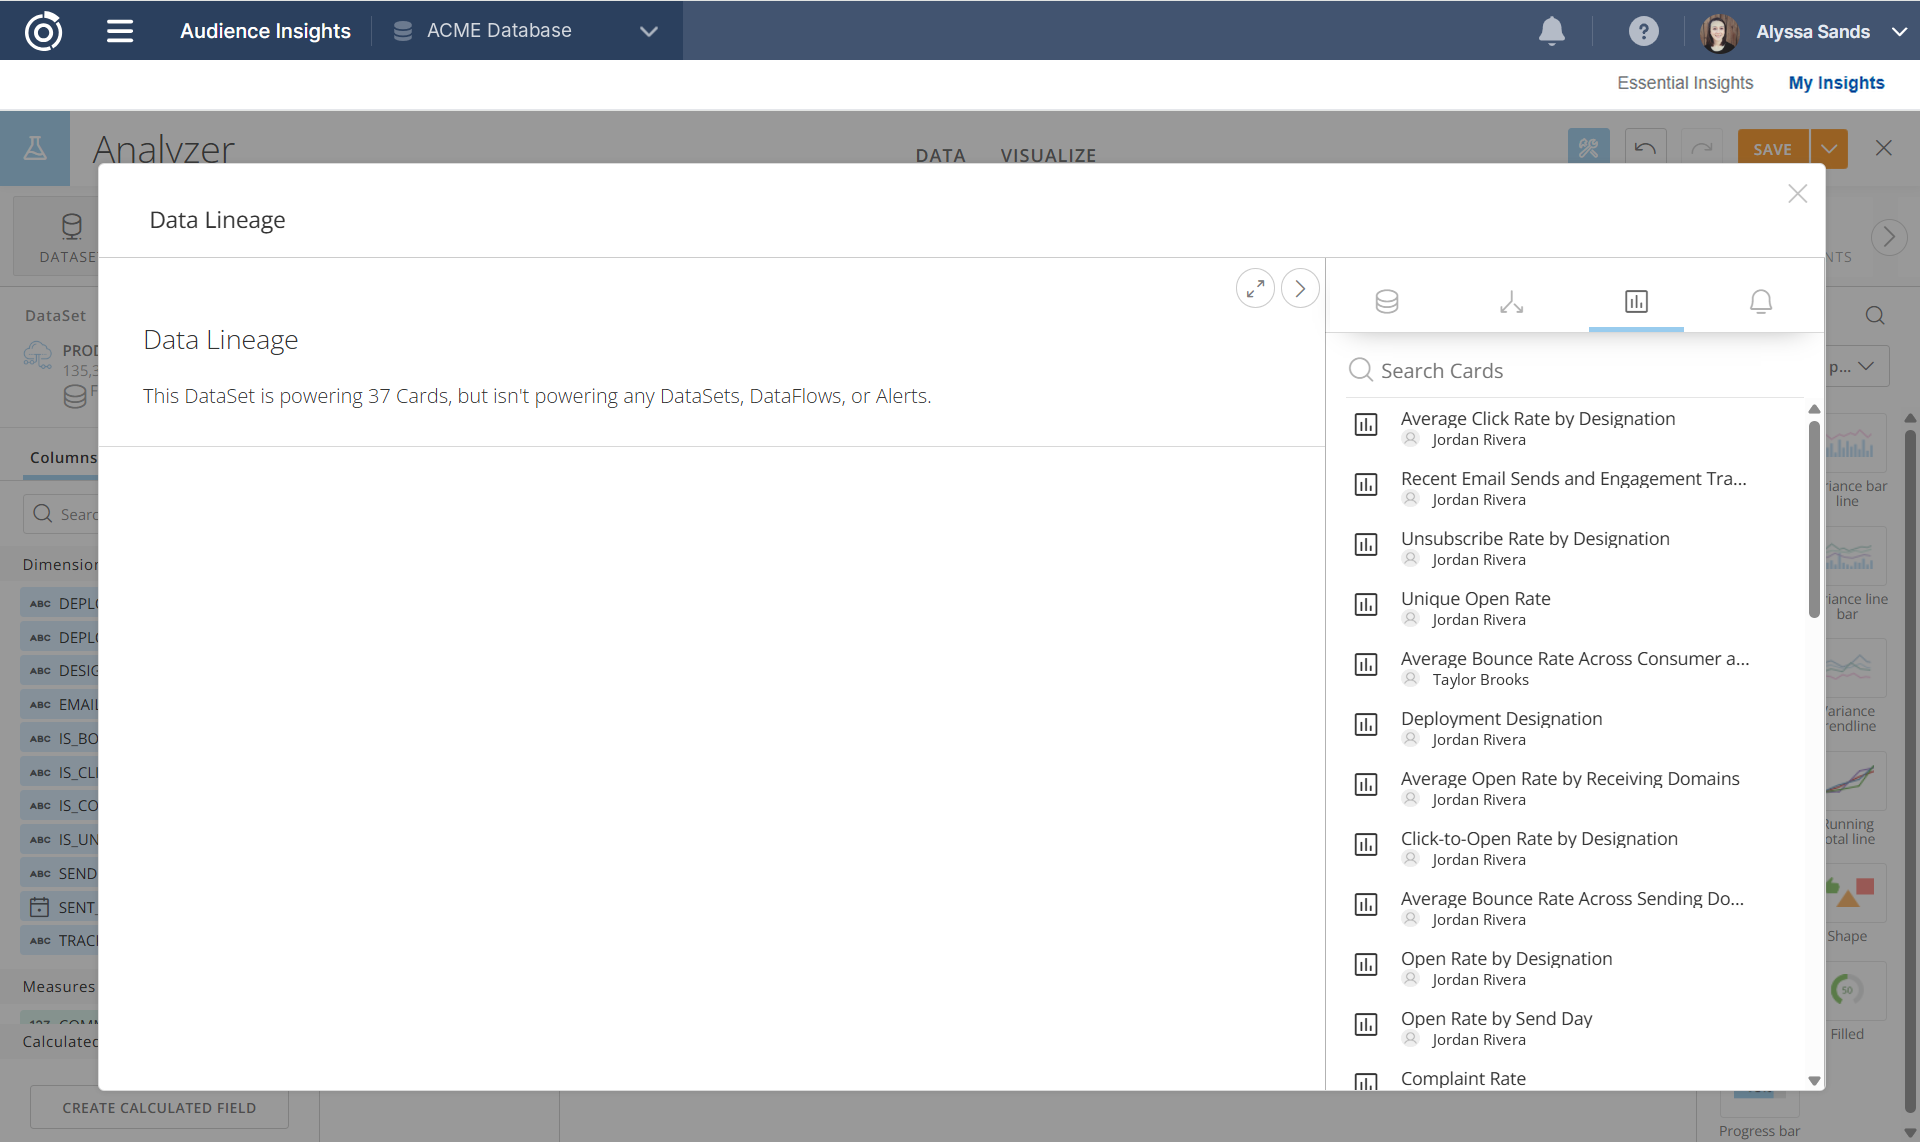
Select Lineage in the toolbar, then the cards tab, to see every card built from this card's dataset, along with each card's owner. The top of the window shows how many cards the dataset powers. Use it to check whether a card you need already exists before building a new one.
Other Analyzer tools
-
Data and Visualize tabs: switch between the rows behind the card and the chart
-
Properties: formatting options such as legend, labels, and axis scales. The options vary by chart type.
-
Color Rules: color values that meet a condition
-
Data Table: show a table of the data below the chart
Tips
-
Counting customers: CUSTOMER_ID is listed as a Measure, but adding up IDs doesn't mean anything. To count unique customers, set the Y axis to Count (Distinct) of CUSTOMER_ID.
-
ENVIRONMENT_ID: every dataset includes this column. It identifies your Omeda database and you won't usually need it.
-
Start from Essential Insights: if an Essential Insights card is close to what you need, it's often faster to start from a copy of it. Click Save as under Card Options to save as your own version.
Additional Resources
-
Audience Insights Data Sources
Review the datasets, columns, and calculated fields you can build from. -
Building a Dashboard
Create a dashboard, add cards, and arrange the layout. -
Building Your Own App
Start a new app from Essential Insights and customize it.
Table of Contents